Embed Information in Context
Based on Endsley & Jones’ Designing for Situation Awareness: An Approach to User-Centered Design, this pattern emphasizes embedding supporting information directly within the primary display, so critical relationships can be perceived immediately without mental reconstruction.
Note:
To view dashboard images in a larger format, right-click on the picture and select "Open Image in New Tab."
What This Pattern Is
This design pattern focuses on making context visible at the point of use. Instead of separating process data, events, and diagnostics into different views, supporting information is embedded directly into the primary visualization where decisions are made.
- Process states, events, or phases are shown in-line with time-series data.
- Diagnostic meaning (limits, violations, annotations) is displayed where the data occurs.
- Operators can immediately understand what happened, when it happened, and why it matters.
Benefits
- Reduces cognitive effort — operators no longer need to mentally align trends, events, and limits.
- Improves comprehension — relationships between process behavior and system state are immediately visible.
- Supports projection — embedded context helps users anticipate consequences and outcomes.
- Accelerates diagnosis — abnormal conditions are recognized faster because meaning is shown in place.
Pattern Demonstration
The following demonstration applies this pattern to Clean-In-Place (CIP) analysis. Traditional trends show process variables in isolation. This design embeds CIP step transitions and diagnostic annotations directly into the trend, providing immediate operational context.
🎥 Demonstration Video
Silent demo — visuals only
📷 Dashboard Views
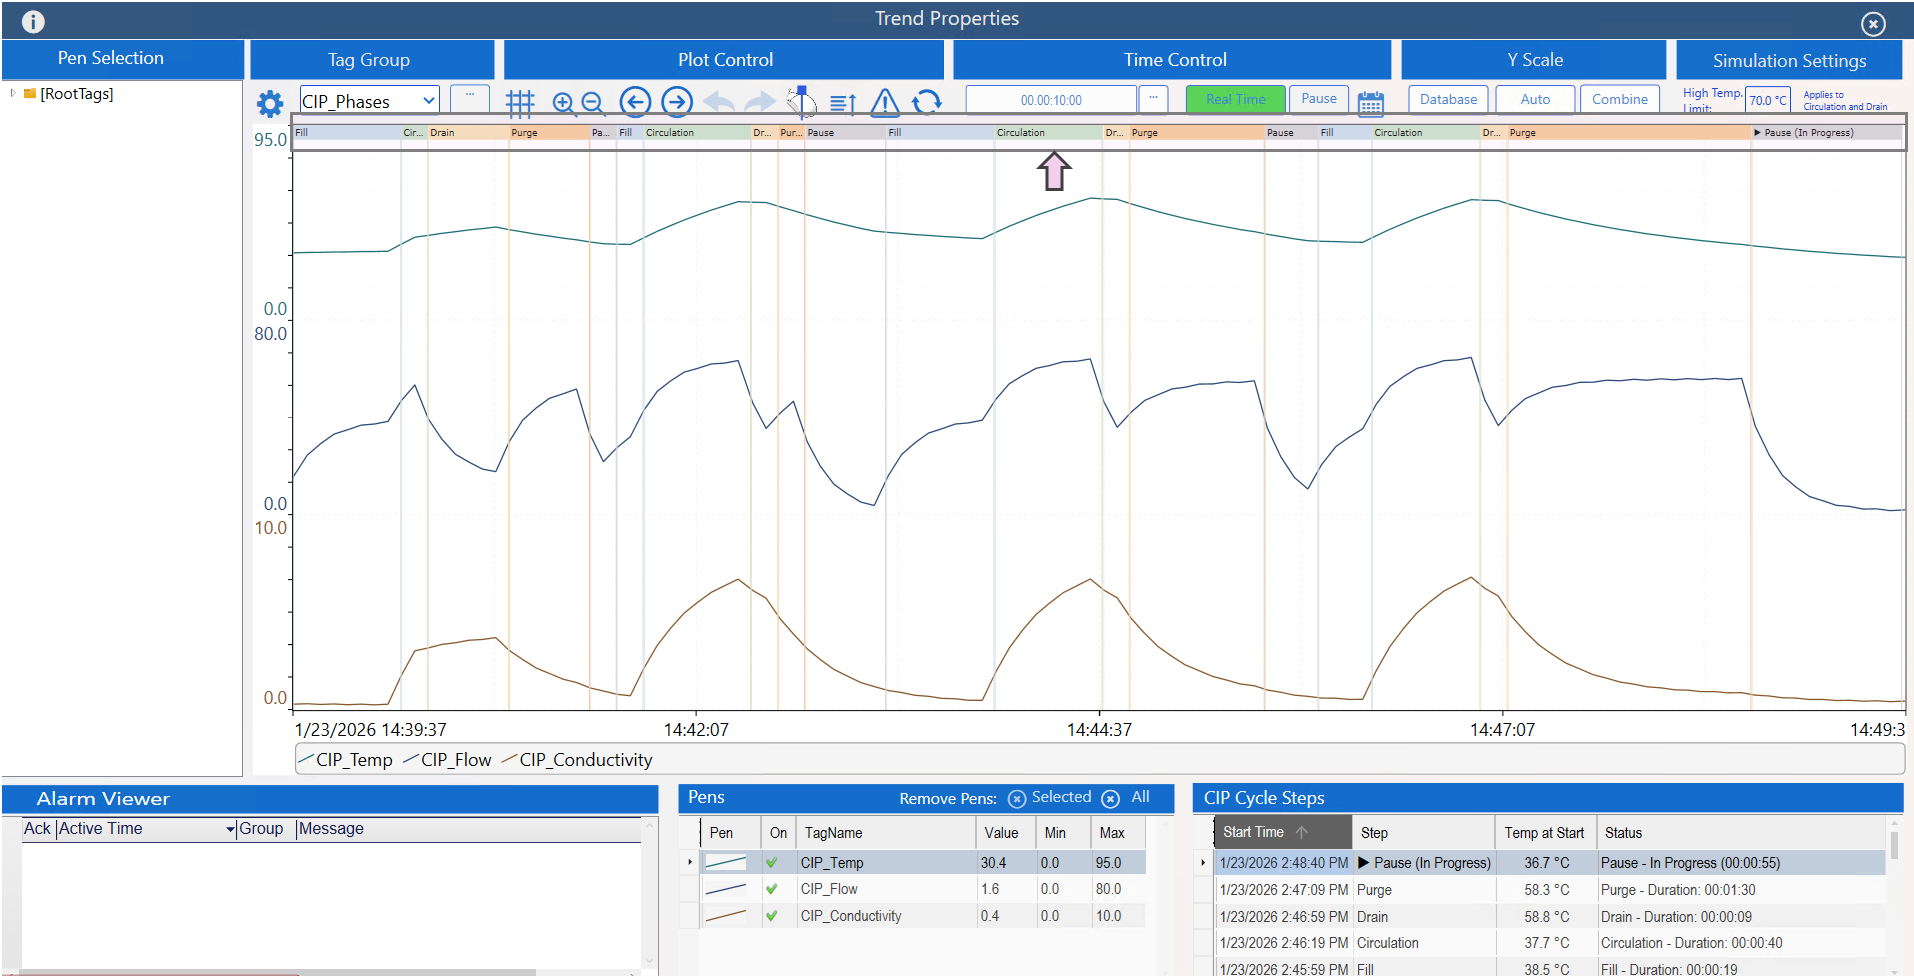
- CIP Phase Transitions: Step changes (Fill, Circulation, Drain, Purge, Pause) are rendered directly on the trend timeline, allowing operators to see exact transition points without referencing tables or reports.
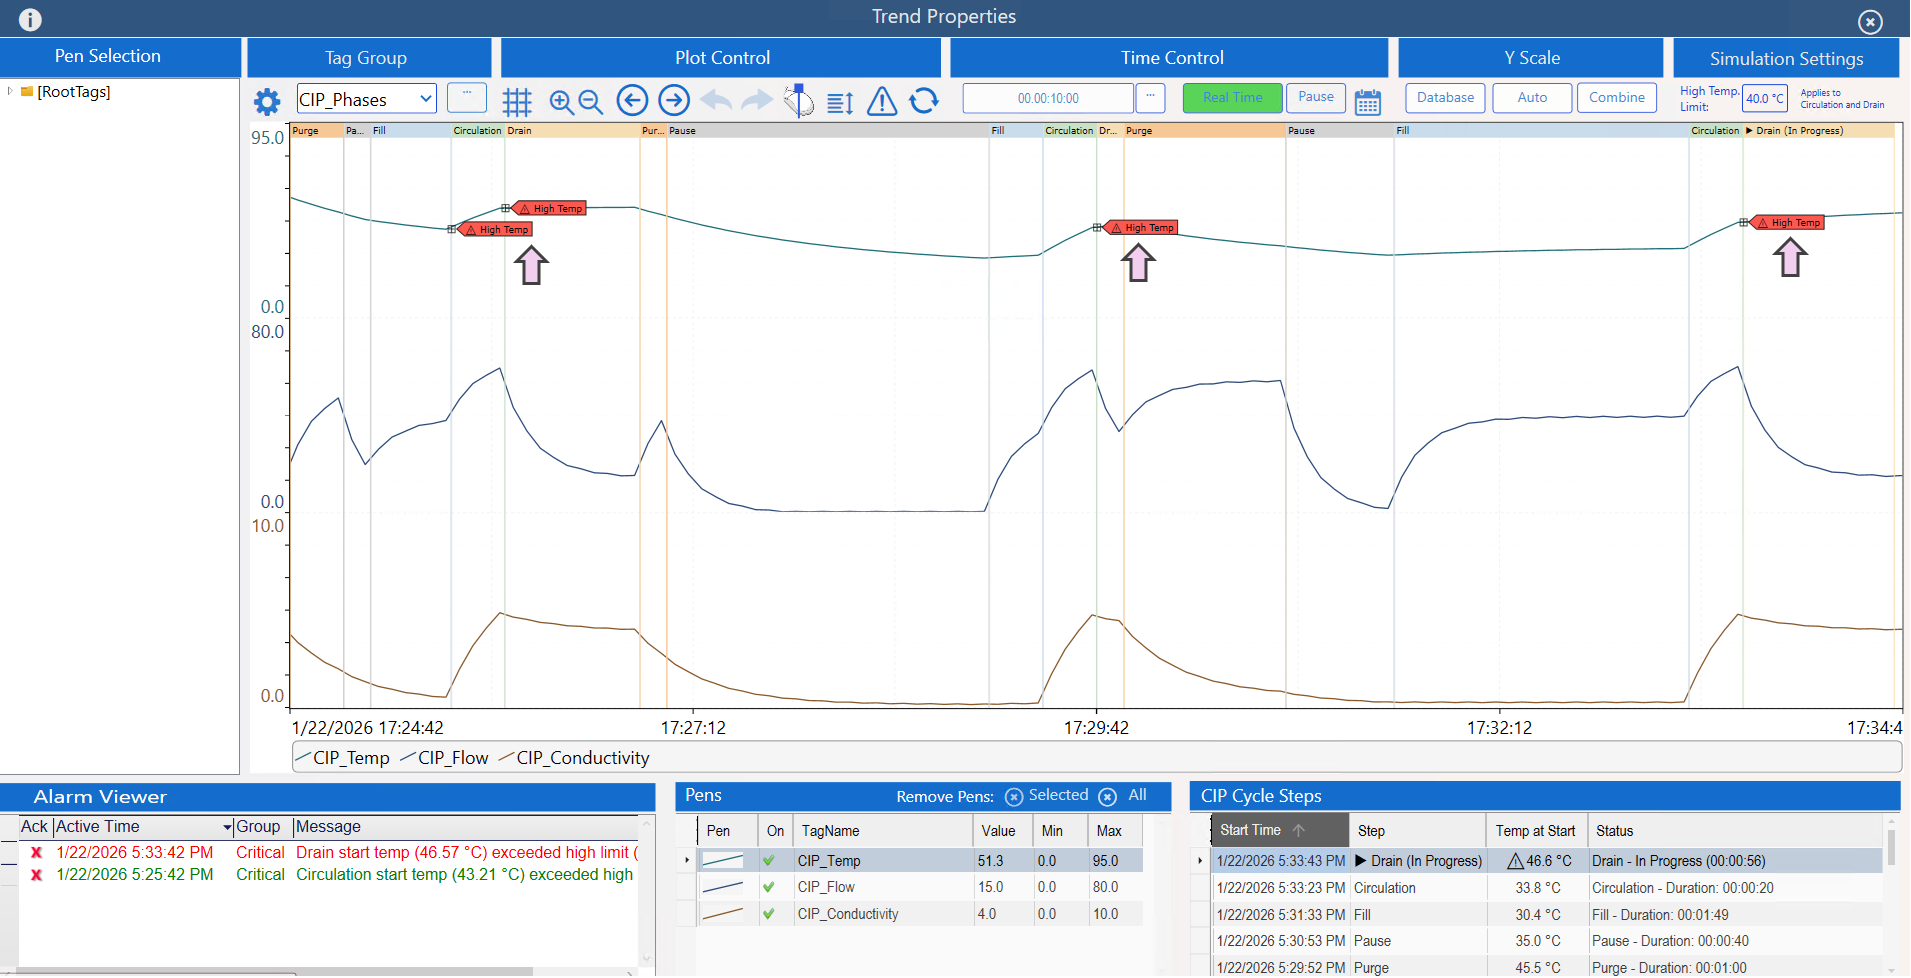
- Embedded Diagnostic Annotations: High-temperature conditions at the start of Circulation and Drain are annotated directly on the trend, eliminating the need to infer violations from raw values or search alarm lists.
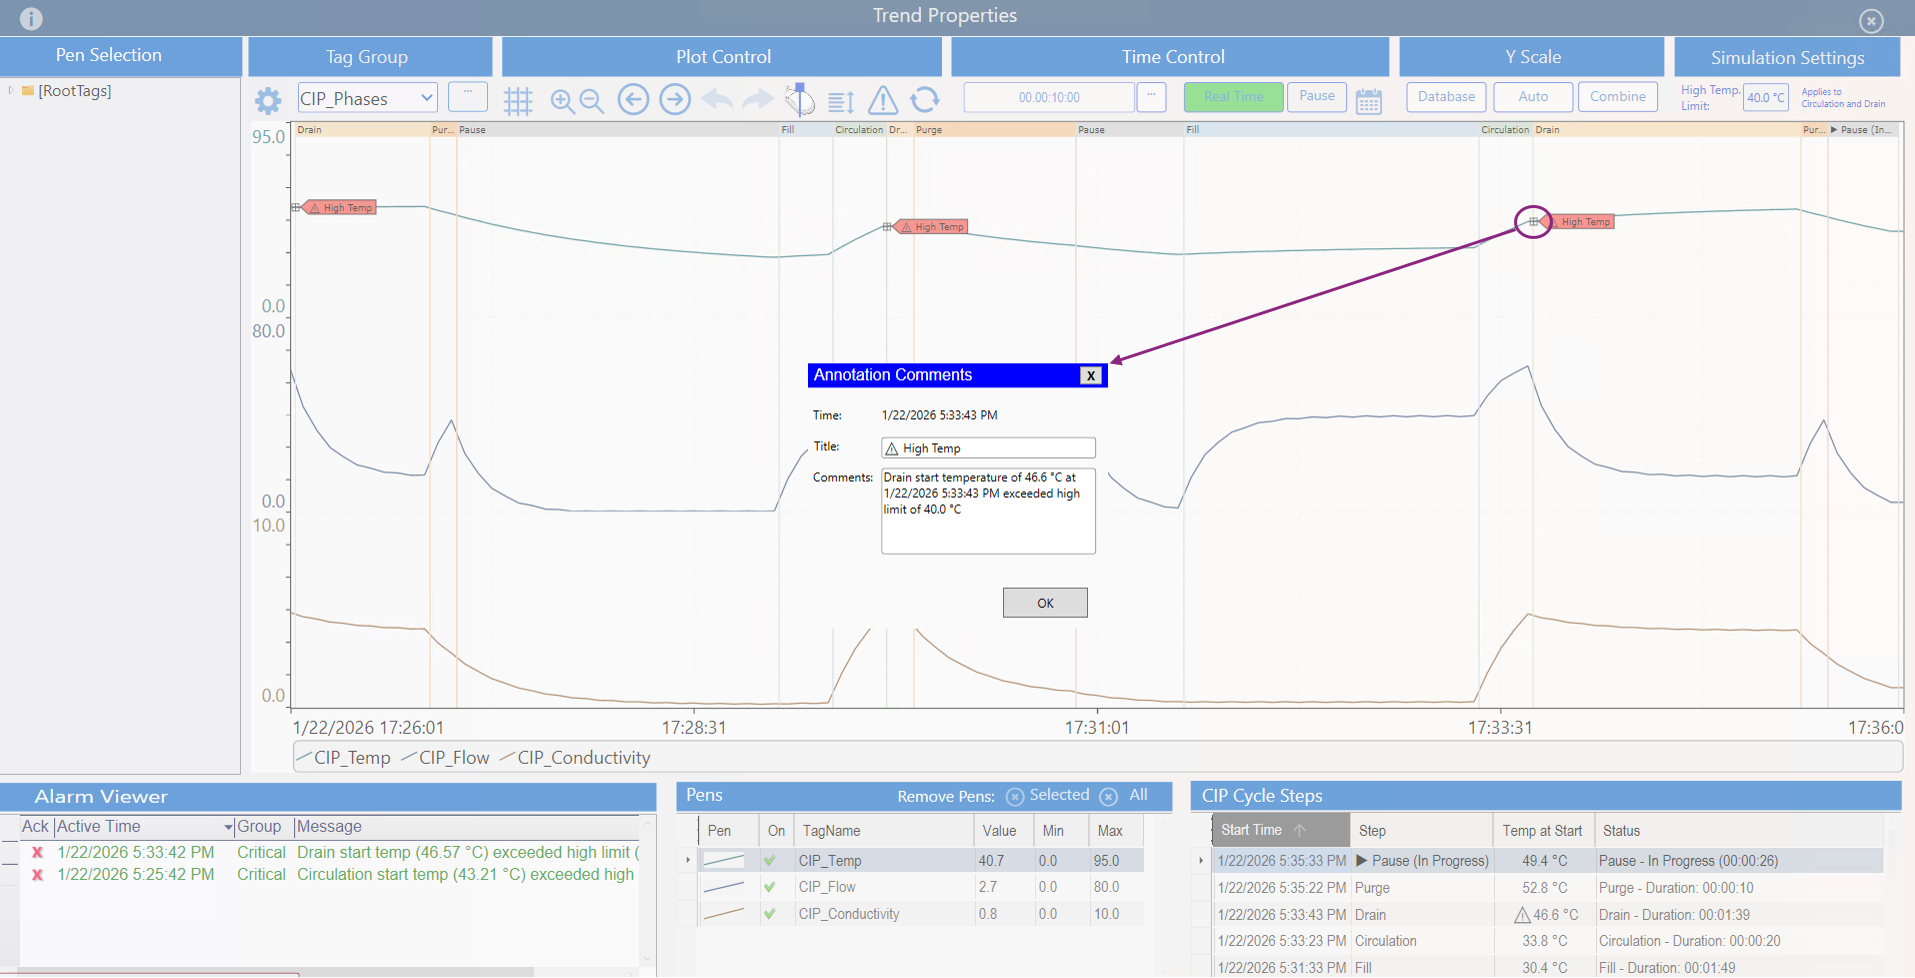
- Meaning at the Moment of Occurrence: Selecting an annotation reveals why the condition matters (e.g., start temperature exceeded limit), tightly coupling data, event, and interpretation in a single view.
Implementation Notes
- CIP phase transitions were generated as range annotation events and rendered directly in the trend to eliminate time-alignment effort.
- High-temperature conditions were embedded as annotations instead of relying solely on alarms or external reports.
- The design prioritizes perceptual clarity over interaction complexity — no drill-down is required to understand what occurred.
Reference: Mica R. Endsley & Debra G. Jones, Designing for Situation Awareness: An Approach to User-Centered Design. Design Schema 7 — Embed Supporting Information in Context.