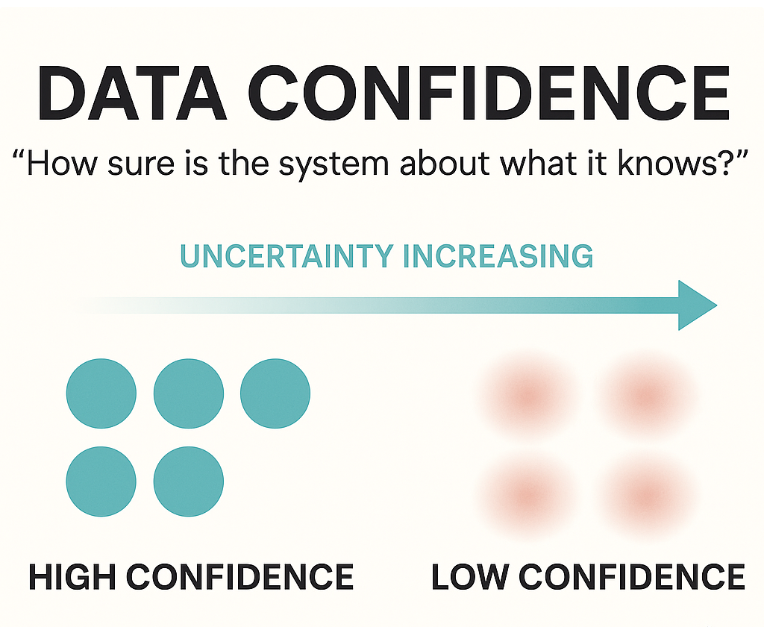
Why It Matters
Data Confidence helps operators assess how much trust to place in the displayed information — especially when that information is calculated or computed from multiple inputs.
- Calculated values often depend on several sensor readings or data sources.
- If one input is stale, missing, or unreliable, the calculated result may no longer represent reality.
- Providing a clear sense of confidence allows users to balance trust and verification, rather than assuming all data is equally reliable.
- When confidence is visible, users can act with awareness — not assumption.
Related to Endsley’s Principle 13: “Support Assessment of Confidence in Composite Data.”
Operational Impact Examples
- Calculated totals: Confidence in computed values (like total tank volume or total downtime) helps users gauge whether inputs were valid, synchronized, and complete.
- Model-based estimates: When displayed data blends measured and predicted inputs, a confidence score clarifies how much reflects actual readings versus modeled assumptions.
- Averaged readings: When several sensors feed an average, confidence should decrease if one goes stale or off-scale, signaling potential distortion of the calculated result.
Confidence displays don’t just show what the system knows — they reveal how sure it is about what it knows.
Cross-Domain Analogy
Weather Forecasting: Meteorologists don’t just predict that rain will or won’t occur — they communicate a probability (“70% chance of rain”). Likewise, operators benefit when calculated data conveys its degree of certainty, not a binary “true/false” impression.

Typical Design Techniques
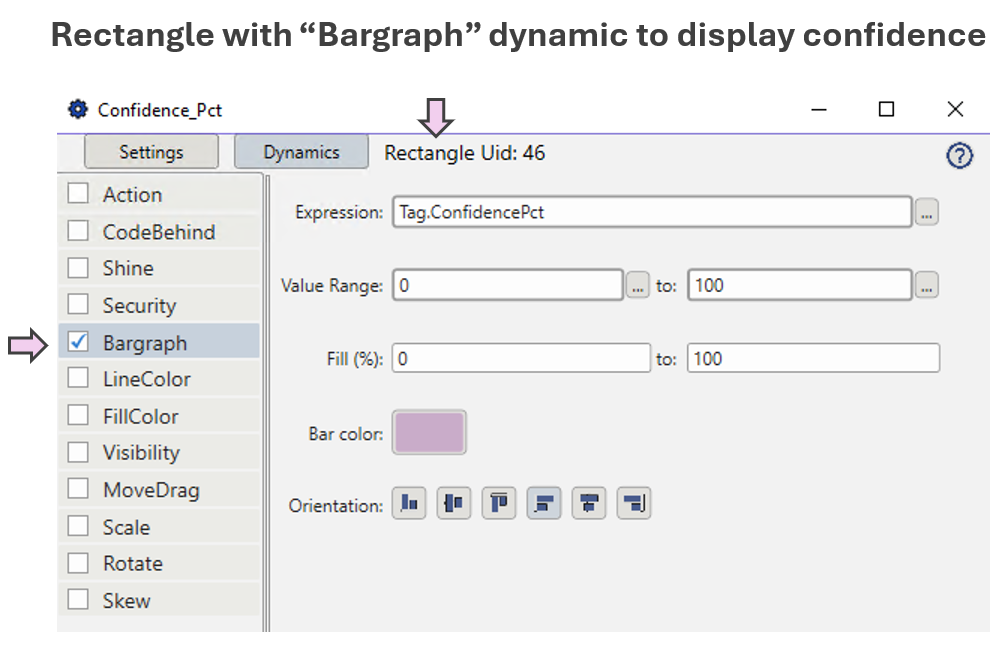
- Confidence bars or shading: Visually represent reliability beneath or beside a calculated value.
- Numerical confidence score (%): Provide a direct readout of certainty for computed results.
- Symbolic cues: Use icons (✓ / ⚠ / ?) or color states (green → amber → red) to express trust level.
- Contextual links: Allow drill-down to see which input sources are lowering confidence.
These techniques help users quickly judge the trustworthiness of calculated data, not merely observe its magnitude.
Use Case for Demonstration in Platform
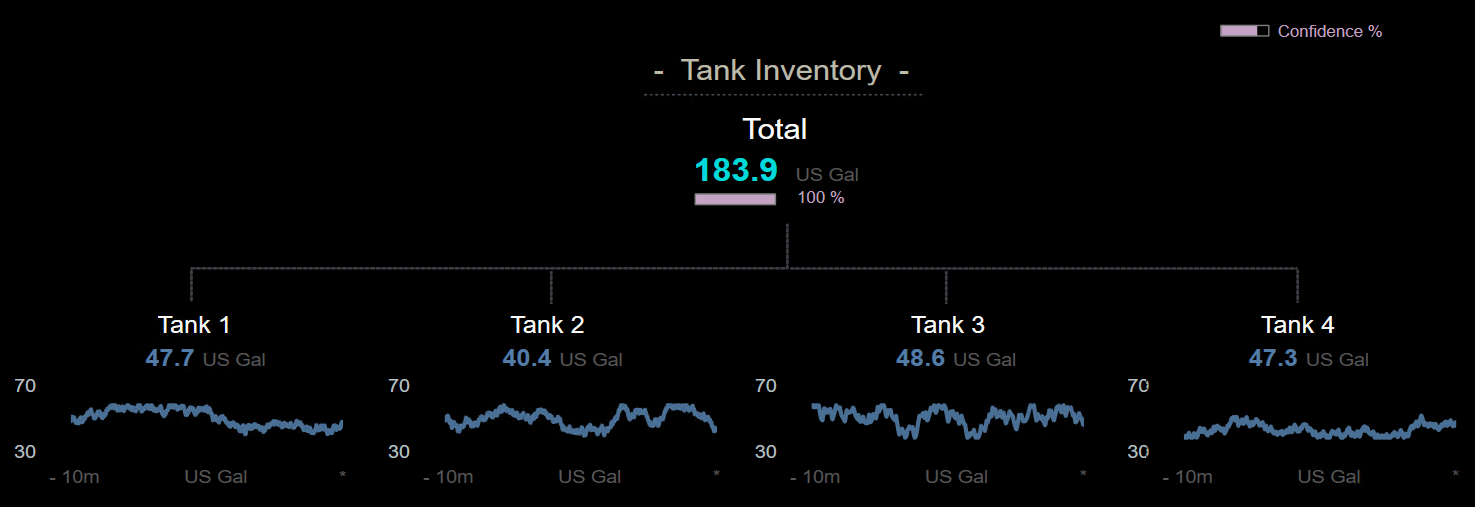
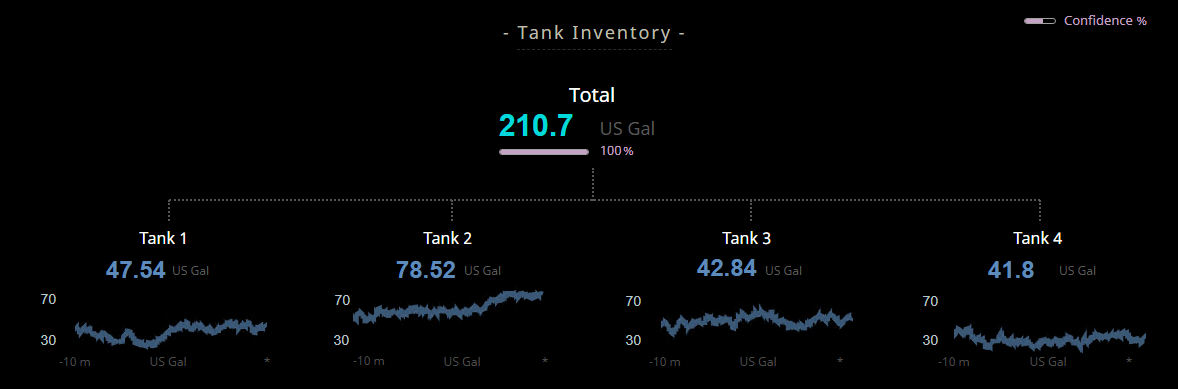
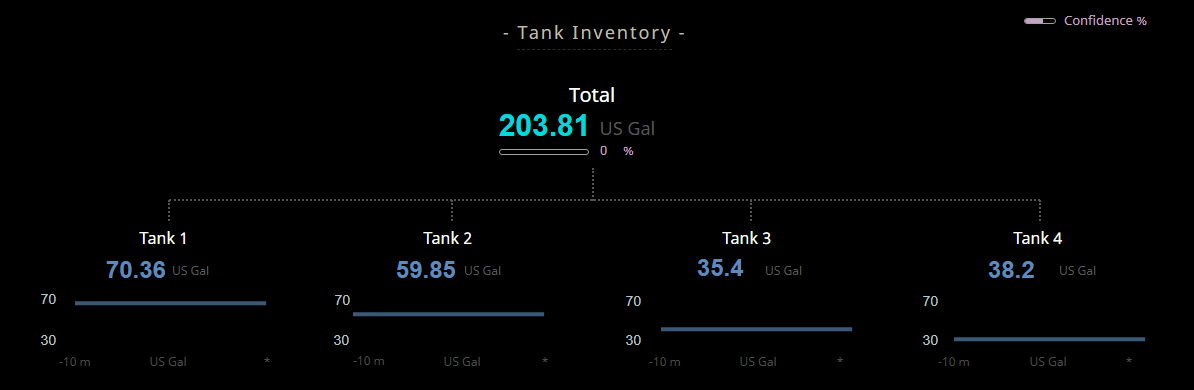
Consider a dashboard that calculates Total Volume from four tanks:
- Each tank reports its level and timestamp.
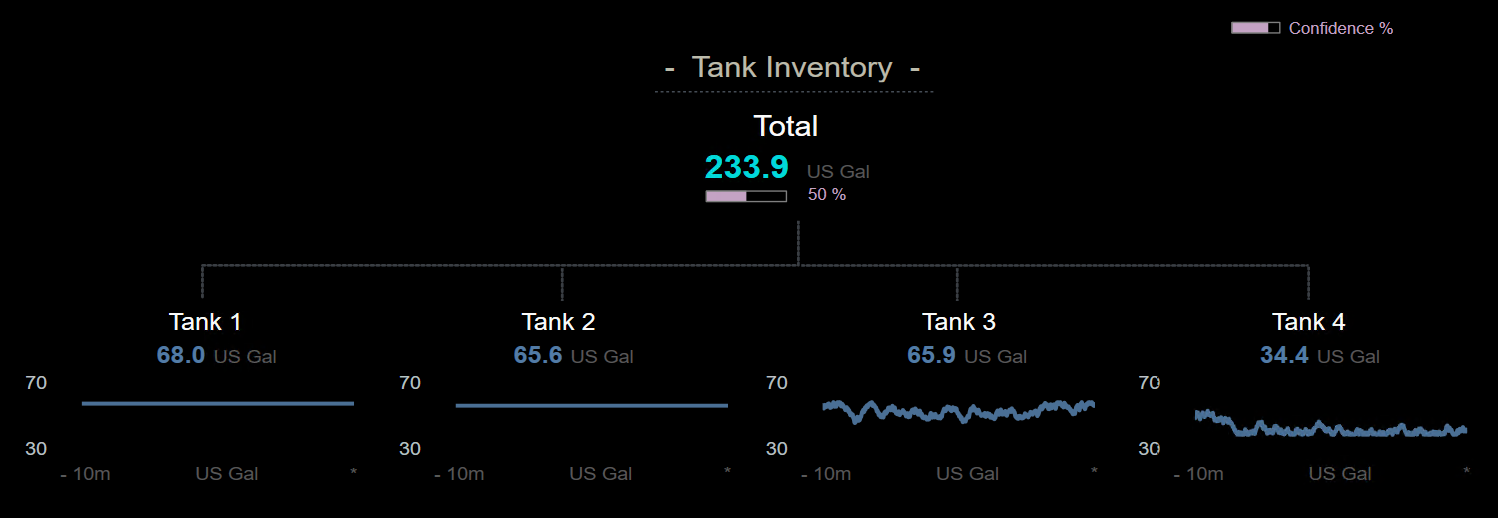
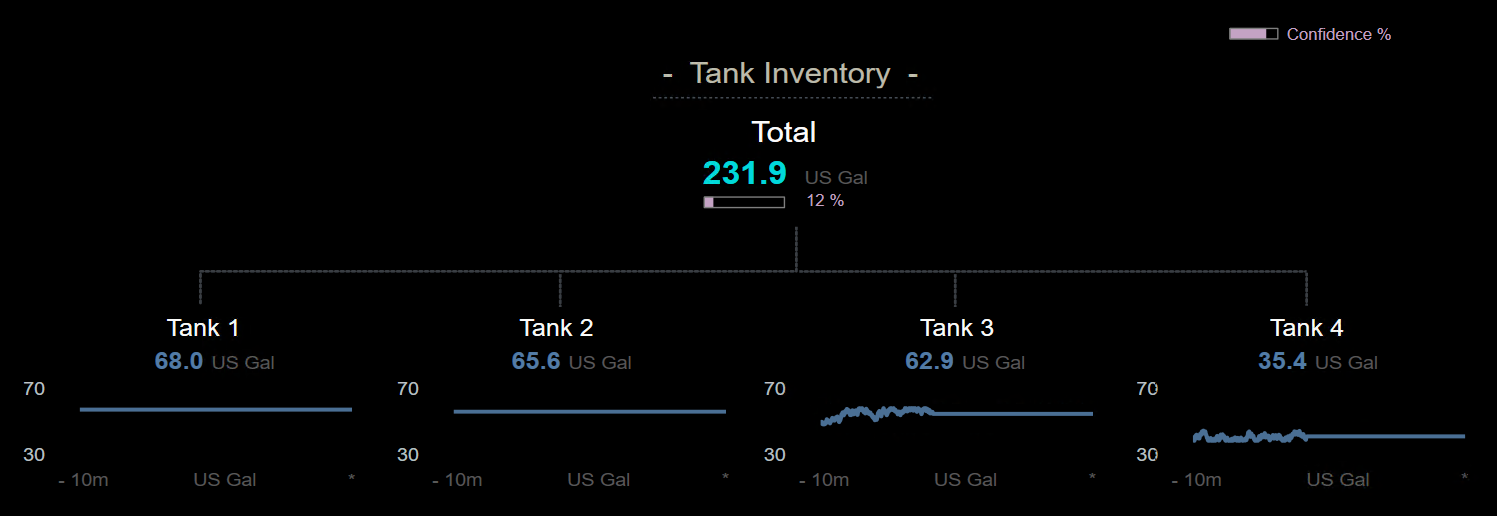
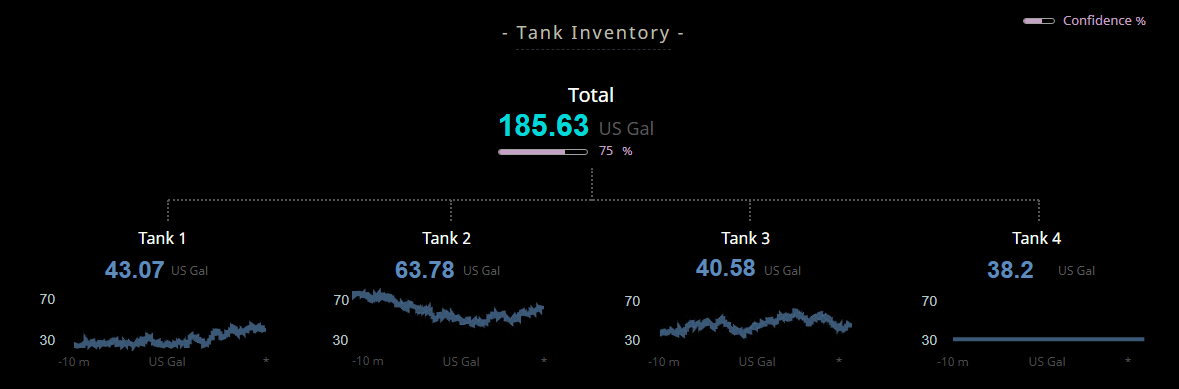
- When a tank’s data becomes stale or invalid, its weight in the total confidence decreases.
- A confidence bar below the total shows the aggregate reliability (0–100%), allowing quick visual judgment of the overall data quality.
Evaluate how well the platform helps users see reliability at a glance — can they immediately sense when a calculated value might not represent reality?
Platforms Used for Demonstration
✅ Ignition Perspective — Demonstration of Confidence Representation
| Aspect | Notes |
|---|---|
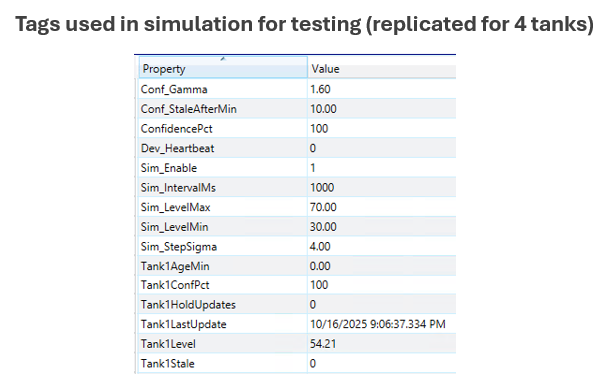
| Implementation Approach | Four simulated tanks produce random volume values with adjustable staleness. Each tank’s update age feeds into a decaying confidence model that determines the reliability of the total. |
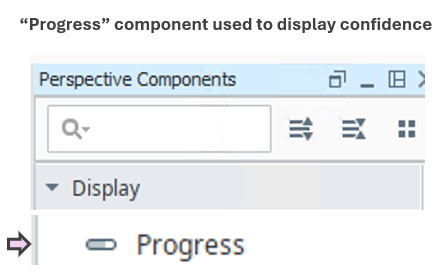
| Display Build | • Confidence bar below total dynamically adjusts from 100 → 0% as inputs age • Hold switches allow simulated stale conditions for demonstration |
| Version Used | Ignition 8.1.x (Perspective) |
✅ Tatsoft FrameworX — Demonstration of Confidence Representation
| Aspect | Notes |
|---|---|
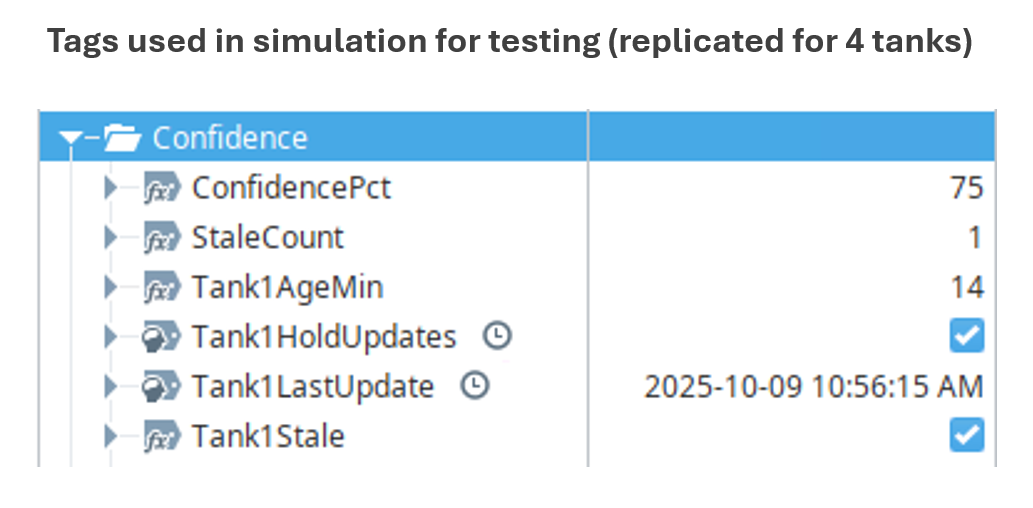
| Implementation Approach | Four simulated tanks generate random level values within a configurable range. Each tank includes a Hold Updates toggle that pauses data changes, allowing its Age (min) to increase. A decaying confidence function reduces reliability as the age approaches a configurable threshold (Conf_StaleAfterMin). |
| Display Build | • Real-time simulation script built in a Periodic Task updates tank levels and confidence values. • Each tank includes an individual confidence percentage and a Hold switch to simulate stale data. • A Total Confidence Bar dynamically adjusts from 100 → 0% based on the average of all active tanks. • Once a tank exceeds its staleness threshold, its Tank#Stale flag activates and the total confidence drops proportionally. |
| Version Used | 10.0.1.464 |