Why It Matters
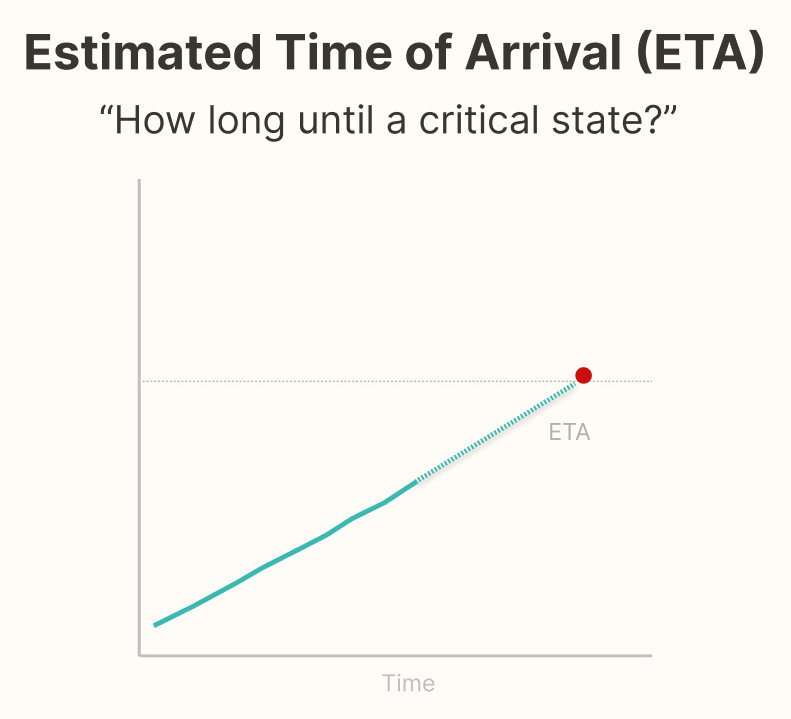
- Operators make better decisions when they know how long until a critical state occurs — not just the current value.
- A clear ETA to full/empty shifts thinking from reaction to planning (e.g., schedule a swap, stage an operator, throttle a valve).
- Expressing the projection directly reduces mental math and avoids the requisite memory trap of remembering past levels and doing rate math on the fly.
Operational Impact Examples
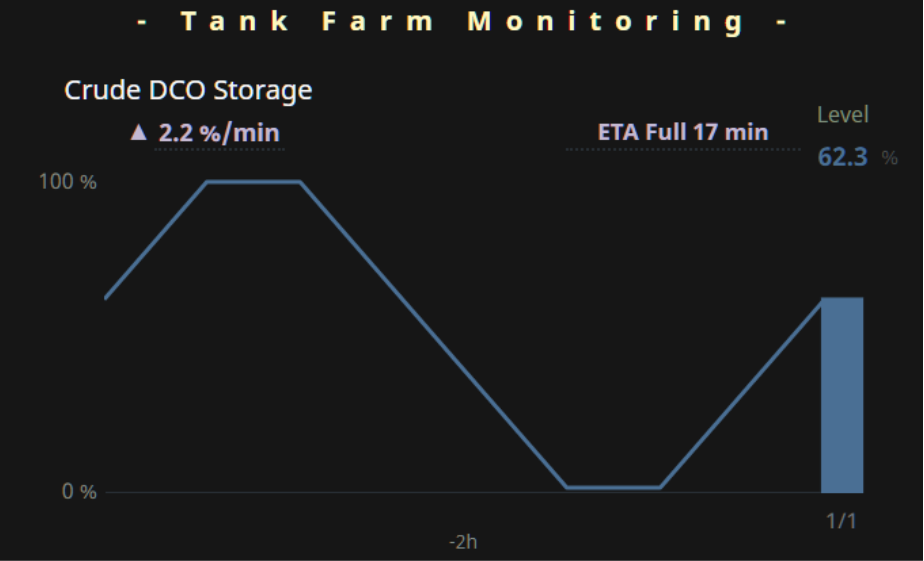
- Transfer line to surge tank: “ETA Full: 17 min” prompts a controlled setpoint reduction vs. a last-minute scramble.
- Truck unloading bay: “ETA Empty: 9 min” lets logistics call the next truck and avoid idle time.
- Batch step with feed ramp: An increasing ETA flags a drift in actual feed rate before limits are breached.
Presenting ETA directly improves coordination and timing — two levers that often cost nothing but save hours.
Cross-Domain Analogy
GPS Arrival Time: Navigation apps don’t just show distance — they show ETA and keep it updated as your speed changes. Operators benefit from the same pattern: surface how long until a state change at the current rate.

Typical Design Techniques
- Direct ETA readout: “ETA Full: 39 min” / “ETA Empty: 12 min.”
- Smoothing of rate: Light EMA or rolling slope to avoid flicker; suppress ETA when
|rate|is below a threshold. - Context-aware units: Rate of change expressed as percent or other process engineering units (%/min, gal/min, L/min, in/min).
- Boundary handling: When near min/max, show “—” or “At Full/Empty” instead of unstable ETAs.
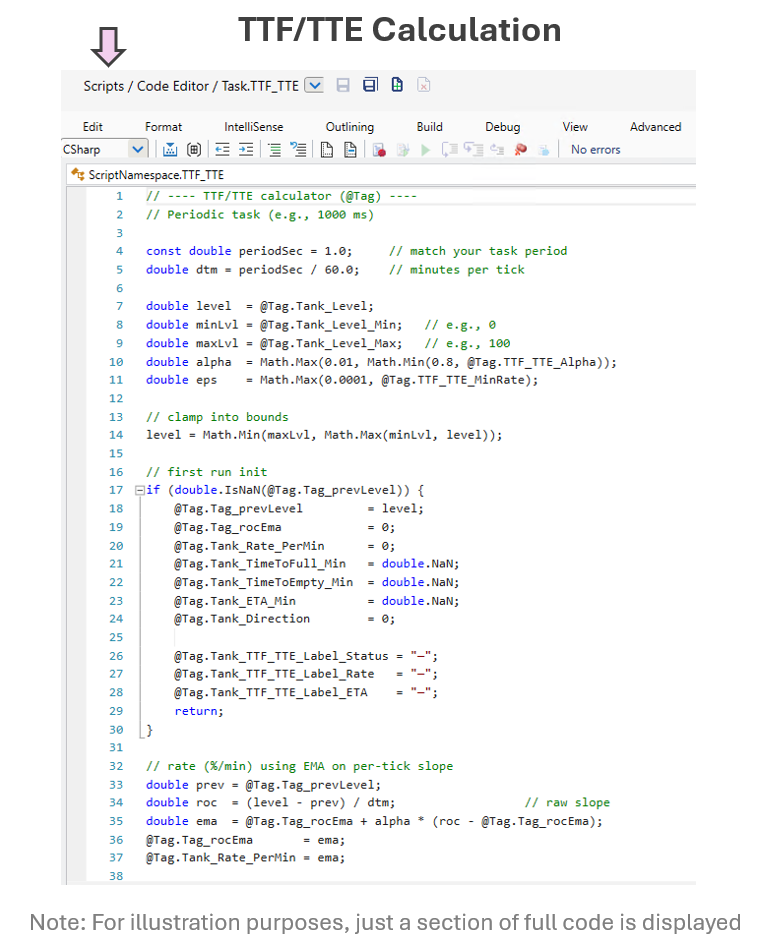
Use Case for Demonstration in Platform
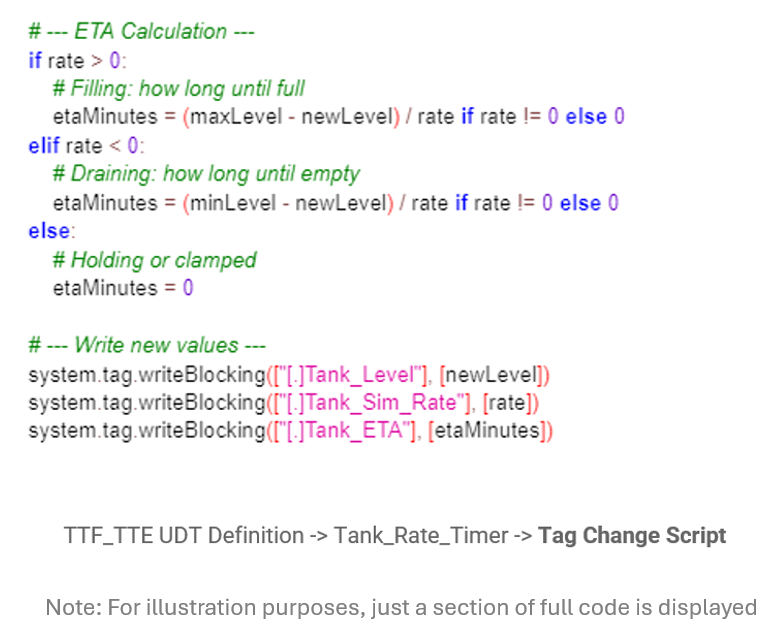
Goal: Display Filling/Draining, Rate, and ETA for a tank level using only runtime tags and a lightweight script.
Inputs & outputs: The calculation uses the current tank level, configurable smoothing, and a minimum rate threshold to determine whether the tank is filling, draining, or stable. It outputs the rate of change, estimated time to full or empty, and a direction indicator, along with clear UI labels showing status, rate, and ETA.
Output Labels Examples:
• ▲ Filling at 0.5 %/min from 29.8% → ETA Full: 2h 16m
• ▼ Draining at 0.7 %/min from 65% → ETA Empty: 1h 33m
• Stable when |rate| < MinRate → ETA shows “—”
Platforms Used for Demonstration
✅ FrameworX — Demonstration of ETA (Time to Full/Empty)
| Aspect | Notes |
|---|---|
| Implementation Approach | Server script with @Tag reads level, computes smoothed rate (EMA) and ETA; suppresses ETA when below threshold. |
| Display Build | Three labels bound separately: Filling/Draining (arrow Up/Down), Rate, ETA. Linear simulator drives fills/drains for this demonstration. |
| Version Used | 10.0.1.464 |
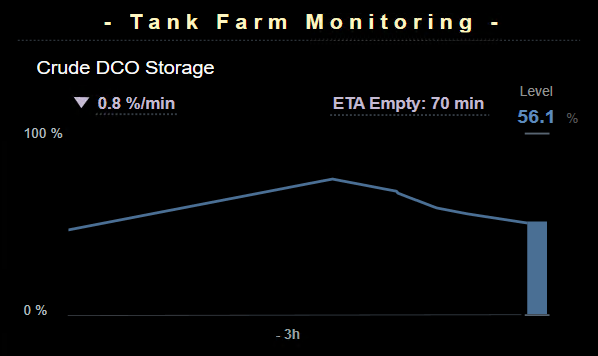
✅ Ignition Perspective — Demonstration of ETA (Time to Full/Empty)
| Aspect | Notes |
|---|---|
| Implementation Approach | Gateway Timer Script reads level/min/max and tuner tags, computes smoothed rate (EMA) and ETA; suppresses ETA when rate is below threshold. Writes results to memory tags (Rate, Direction, ETA, label strings). |
| Display Build | Three labels bound separately: Filling/Draining/Stable (↑/↓/—), Rate (e.g., 0.8 %/min), ETA (e.g., ETA Empty: 70 min or —). Simple tag-driven simulator used to drive fill/drain for this demonstration. |
| Version Used | Ignition 8.1.x (Perspective) |