Implemented Designs
Real-world dashboards originally built for customers, recreated with simulated data to demonstrate clarity and human-centered SA design.
Each example applies one or more Situation Awareness (SA) principles and SA Design Patterns to show how cognitive theory translates into practical industrial visualization.
Note:
To view dashboard images in a larger format, right-click on the picture and select "Open Image in New Tab."
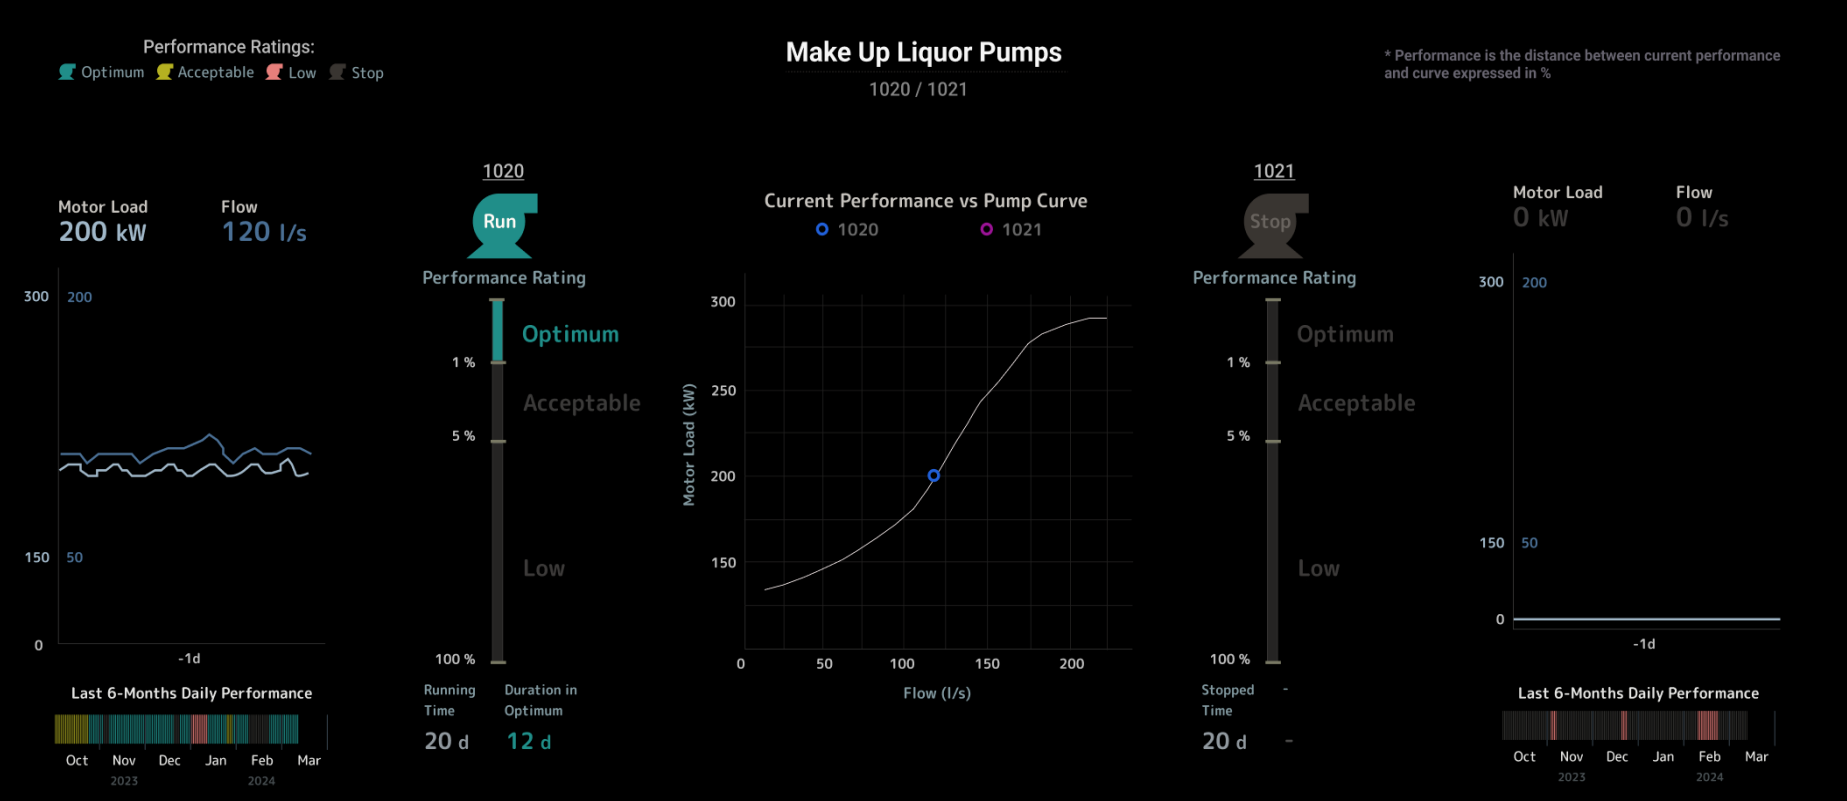
Pump Performance Dashboard
Helps engineers monitor the performance of critical pumps by tracking how far current operating points deviate from the manufacturer’s pump curve — making it easier to identify underperformance early and guide corrective action.
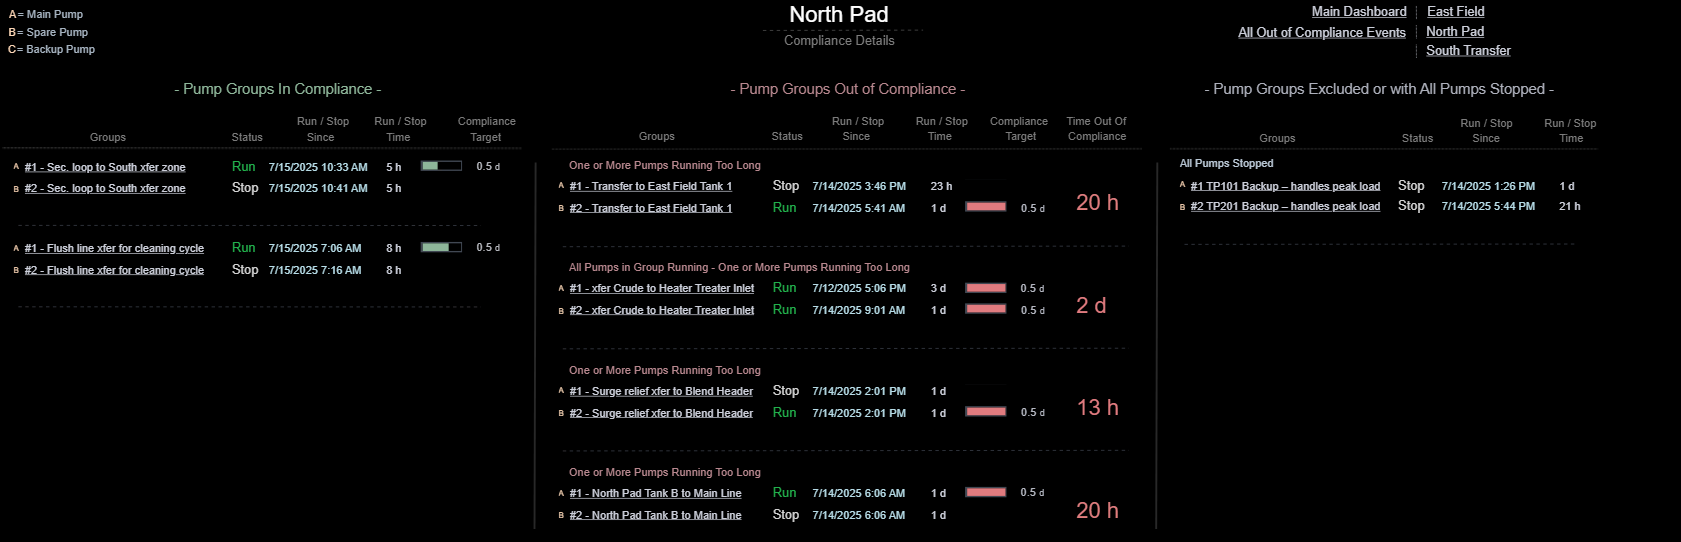
Pump Compliance Tracker
Shows which pumps are operating outside defined limits, for how long, and when the condition began. Designed to support reliability and maintenance teams by revealing non-compliant operation patterns across plant areas, helping prioritize follow-up actions.
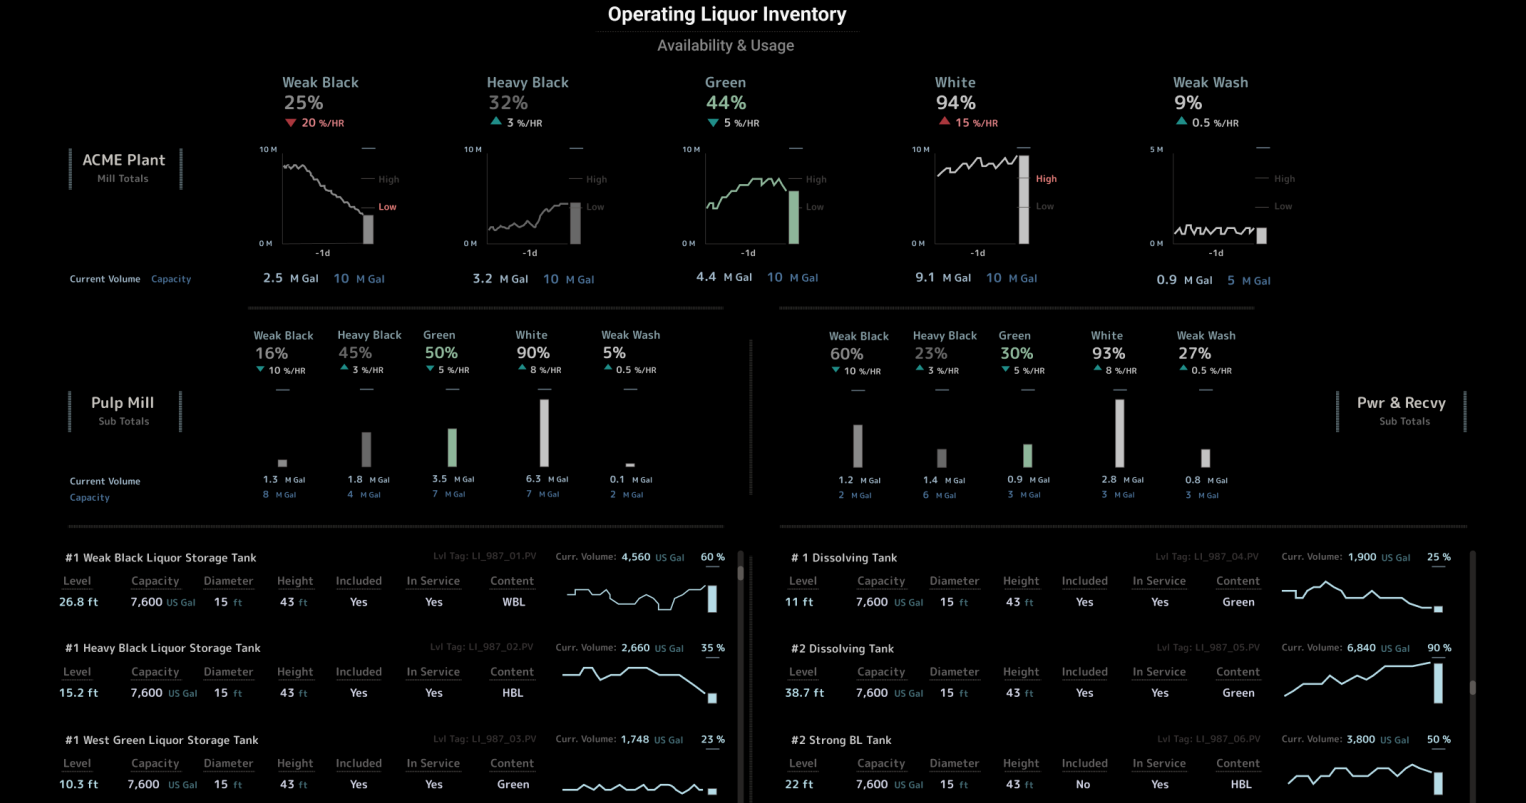
Liquor Inventory Summary
Provides a clear, consolidated view of liquid levels across tanks — ideal for operators managing inventory across multiple vessels and ensuring sufficient availability to maintain production continuity.
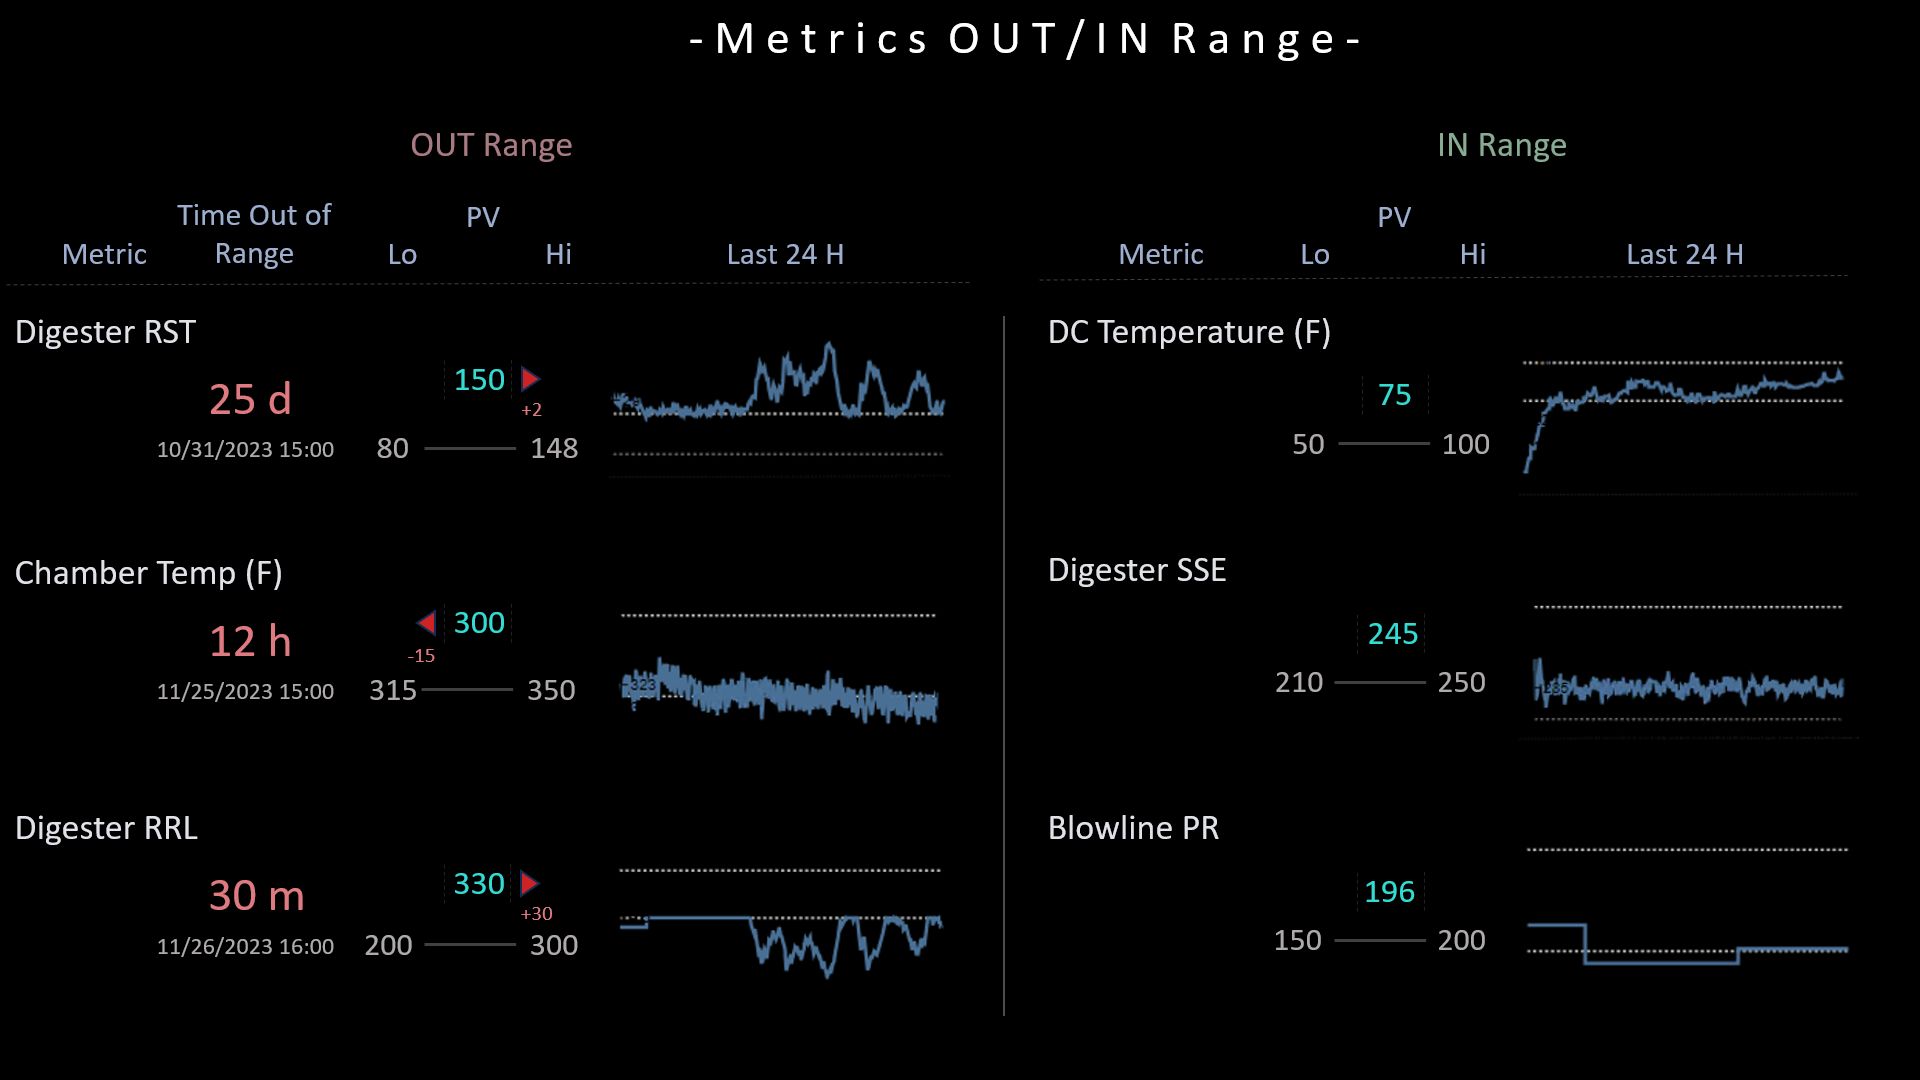
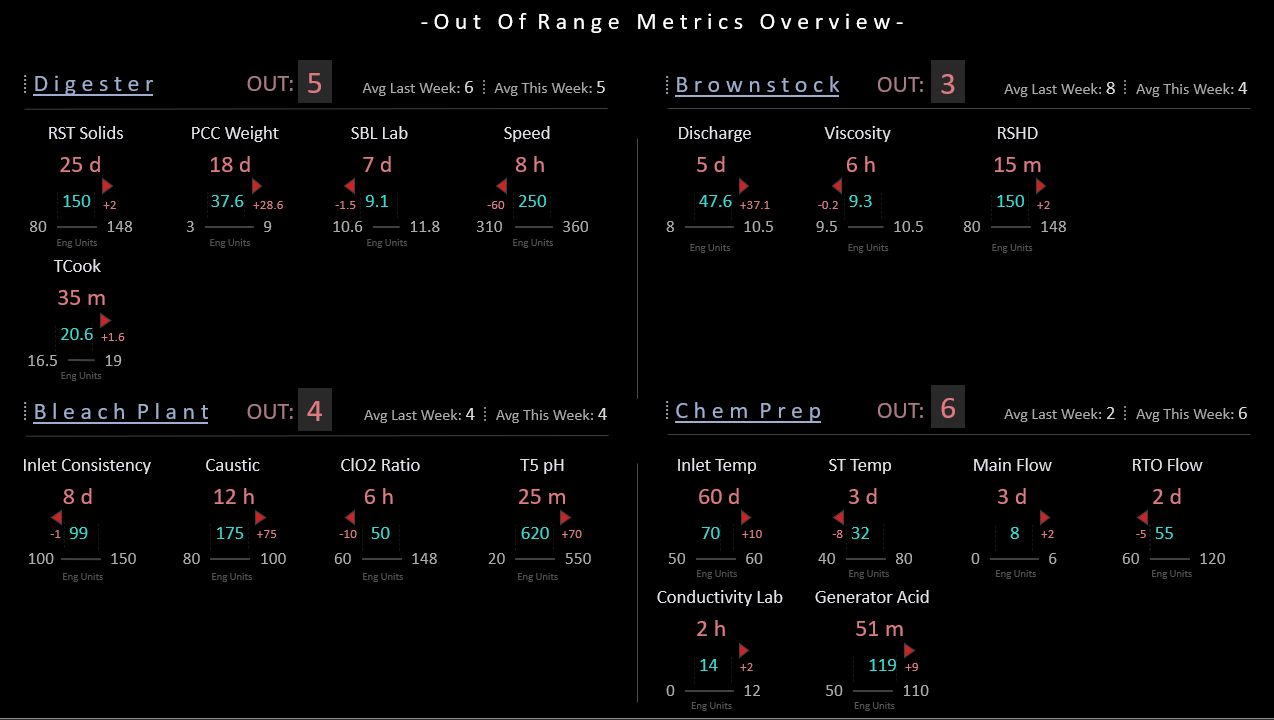
Centerline Monitoring – Main
Provides a top-level snapshot of critical process variables operating outside target ranges in a pulp and paper plant. Highlights both magnitude and duration of deviation to help teams focus attention where stability and quality are at risk.
Centerline Monitoring – Detail
Enables focused monitoring of process variables, showing current values alongside target limits and historical trends. Designed to help operators understand both real-time deviation and underlying process behavior.