Daily Moments of SA
These are small, everyday interactions that illustrate key Situation Awareness principles in action.
They help connect abstract SA concepts to familiar experiences.
📱 “57 Minutes Until Full”
Principle: Present SA Level 2 Information Directly – Support Comprehension
Rather than displaying voltage or just a battery percentage, the phone gives you the information that matters:
How long until full?
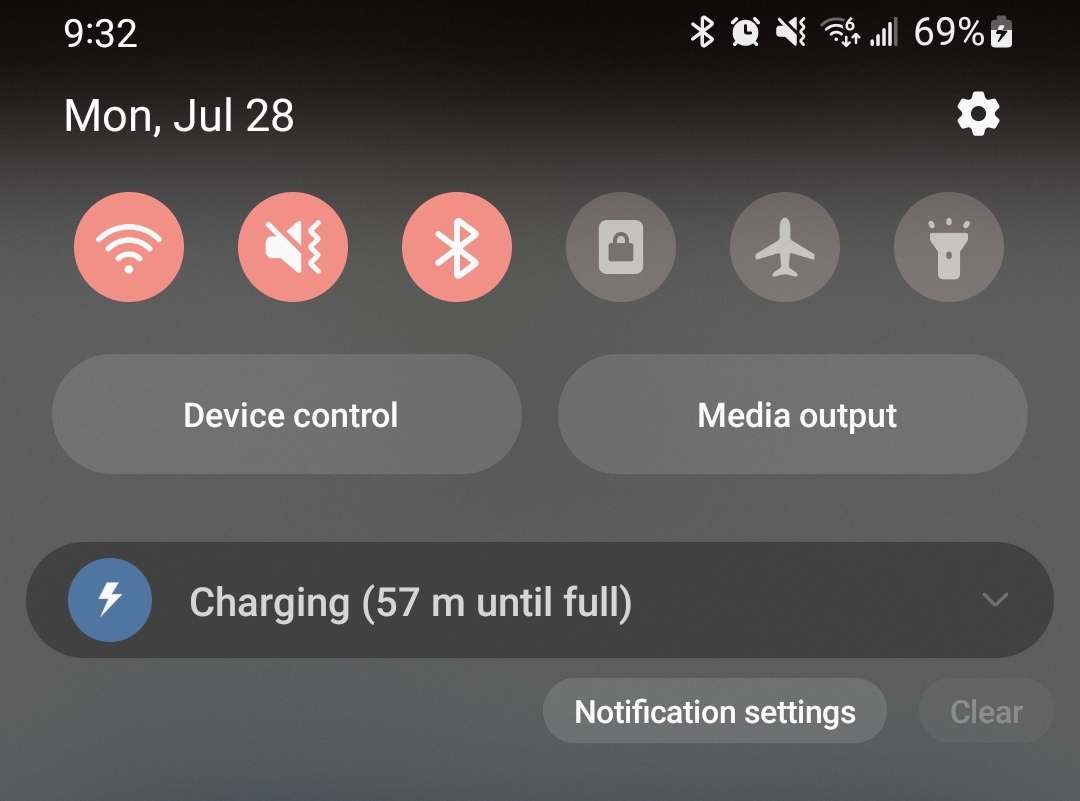
This is Level 2 SA: Comprehension. It reduces the mental effort needed to interpret raw data and helps you plan your day quickly.
→ Imagine if a process dashboard did the same.
🚗 “Object on Road Ahead”
Principle: Provide Assistance for Level 3 SA – Support Projection
Modern GPS systems don’t just show your route. They warn you of possible hazards ahead — an object in the road, or even a police car reported by other drivers.
This forward-looking cue changes how you drive: you might adjust speed, watch nearby lanes, and stay alert for sudden maneuvers. If the hazard is gone, you can even update the system for others.
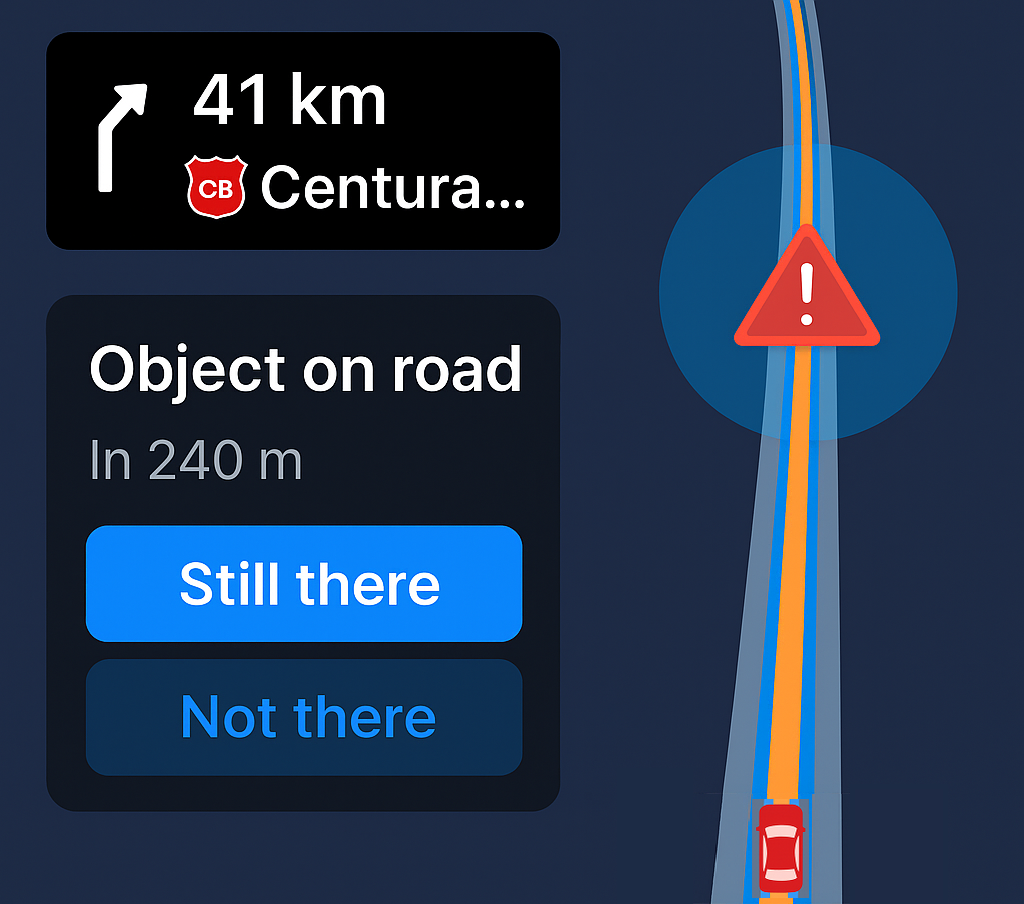
This is Level 3 SA: Projection. The display gives you a picture of what might happen ahead, so you can prepare before it becomes urgent.
→ Imagine if a process dashboard did the same — alerting you to what’s likely to happen next, so you can adjust process parameters proactively and avoid reacting too late, causing issues and inefficiencies.
🚀 “A Clear Picture of Launch”
Principle: Maintain Situational Awareness across multiple aspects of the environment
SpaceX live broadcasts demonstrate how a single display tile can keep the public oriented through every stage of a launch. Instead of raw telemetry, key metrics are always visible: speed, altitude, and mission elapsed time.
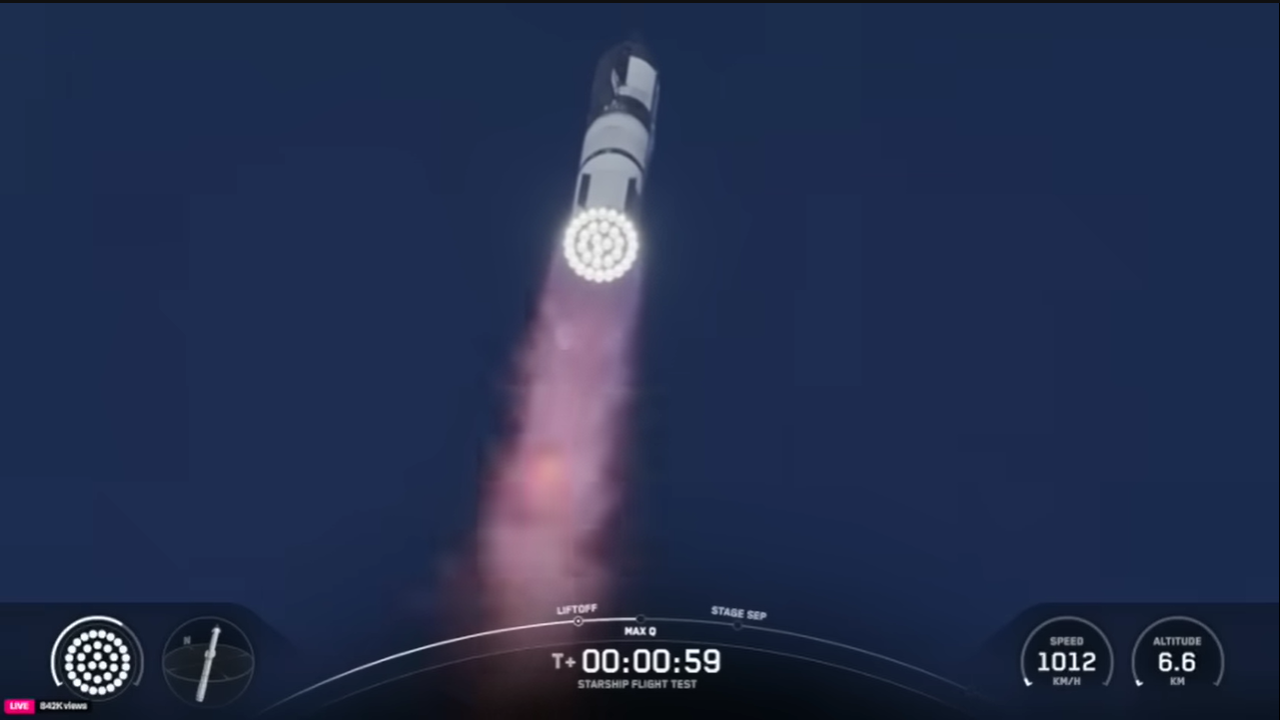
A timeline highlights completed milestones (e.g., Max-Q, stage separation) and anticipates upcoming ones. Simple visuals show engine state and spacecraft orientation, while widgets adapt dynamically to the phase of the mission (such as switching to an orbital view once in space).

→ Imagine if industrial dashboards did the same: keeping essentials visible and adapting seamlessly as processes move through phases.
⚾ “A Clear Picture of the Game”
Principle: Support Global SA – Provide the “Big Picture”
While watching a Major League Baseball playoff game, notice how the scoreboard graphic tells you exactly what you need to understand the situation:
Score, base runners, balls, strikes, outs, inning, pitcher, and batter.
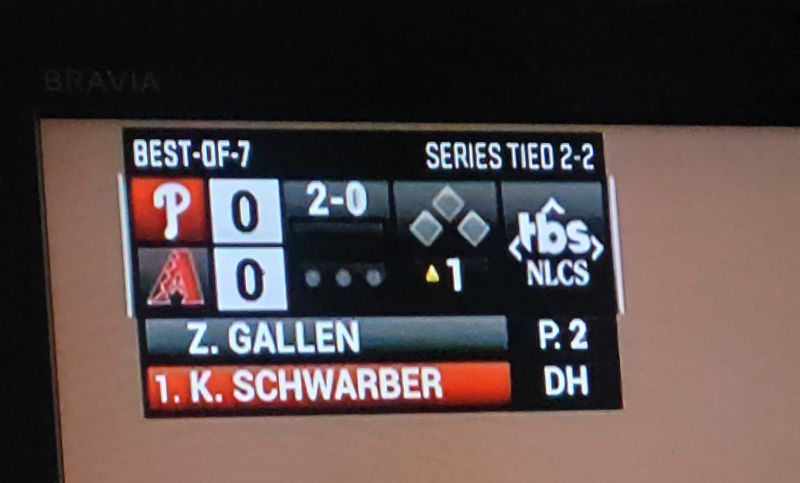
Sure, there are many more statistics available (like fielder’s choice), but to engage with the game right now, this summary provides the global SA needed to follow the action. It discourages attentional narrowing by ensuring the essentials are always visible.
→ Imagine if real-time industrial dashboards followed the same approach: providing the big-picture of the situation, while still allowing drill-down for detailed analysis when necessary.
🤖 “When Automation Explains Itself”
Principle: Provide Automation Transparency and Explainability
Tesla’s Autopilot visualization gives drivers a window into what the automation “sees.” Every blue line, gray car, and bounding box reveals how the system is perceiving and understanding the environment in real time.
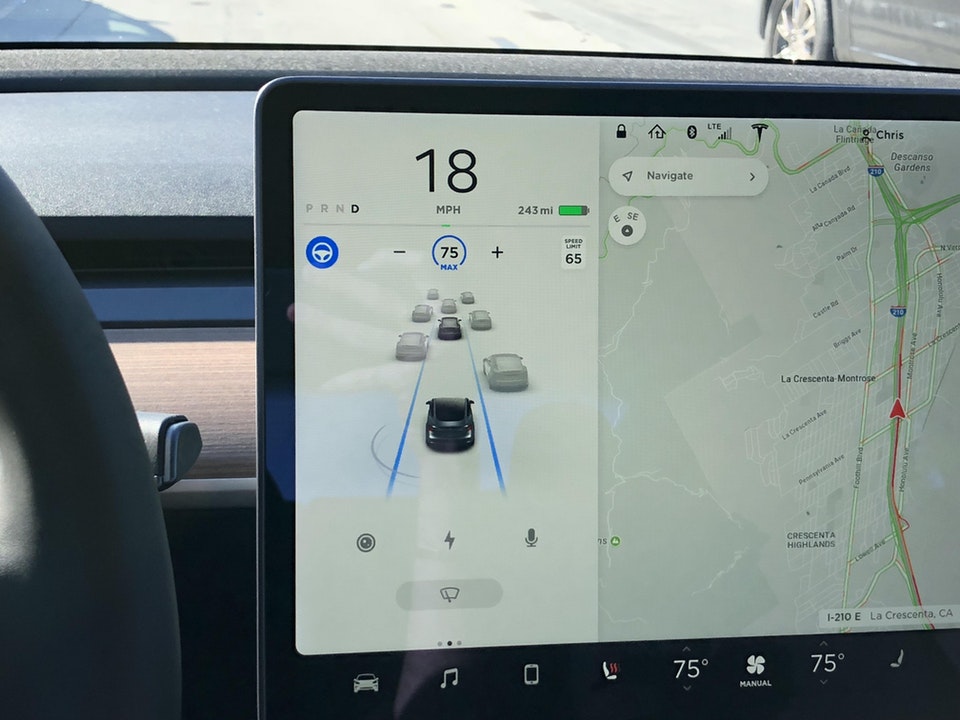
Instead of being a black box, the automation is expressing its awareness. This helps drivers:
- Verify perception: “It sees that car ahead.”
- Comprehend behavior: “It’s braking because it detected slowing traffic.”
- Project next actions: “It will stay centered in its lane.”
Automation that reveals its own SA helps humans maintain theirs — supporting trust, comprehension, and readiness to intervene.
→ Imagine if industrial AI systems showed their awareness like this — helping operators stay in the loop for shared understanding and control.
🏭 “A Common Picture for the Process”
Principle: Support Global SA – Provide the “Big Picture”
In complex industrial settings, attention can easily narrow toward one station or one variable, causing important changes elsewhere to go unnoticed. Displays that maintain visibility of the overall process help prevent this by keeping the “big picture” in view.
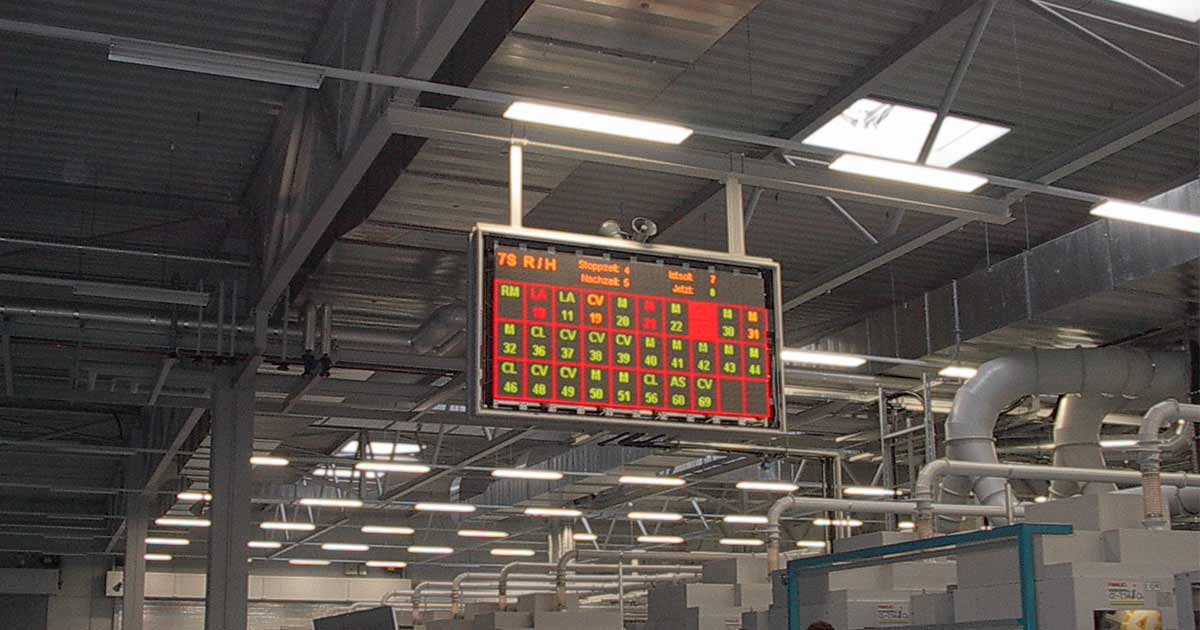
Andon displays act as central overview displays that support Global Situation Awareness—providing a high-level, always-visible summary of plant status. By showing which stations are running, stopped, or signaling for help, they help operators maintain awareness of the whole system, reduce attentional narrowing, and support better prioritization of goals and responses.
→ Imagine if digital dashboards did the same: maintaining a persistent overview that helps users stay oriented, help determine high priority tasks, and anticipate what might happen next.
📈 “The Sliding Ticker Panel”
Principle: Support Global SA – Maintain awareness while working in detail
Some finance websites include a slide-out panel that tracks selected symbols while users explore deeper pages. This simple pattern keeps a high-level overview available without interrupting focused tasks.
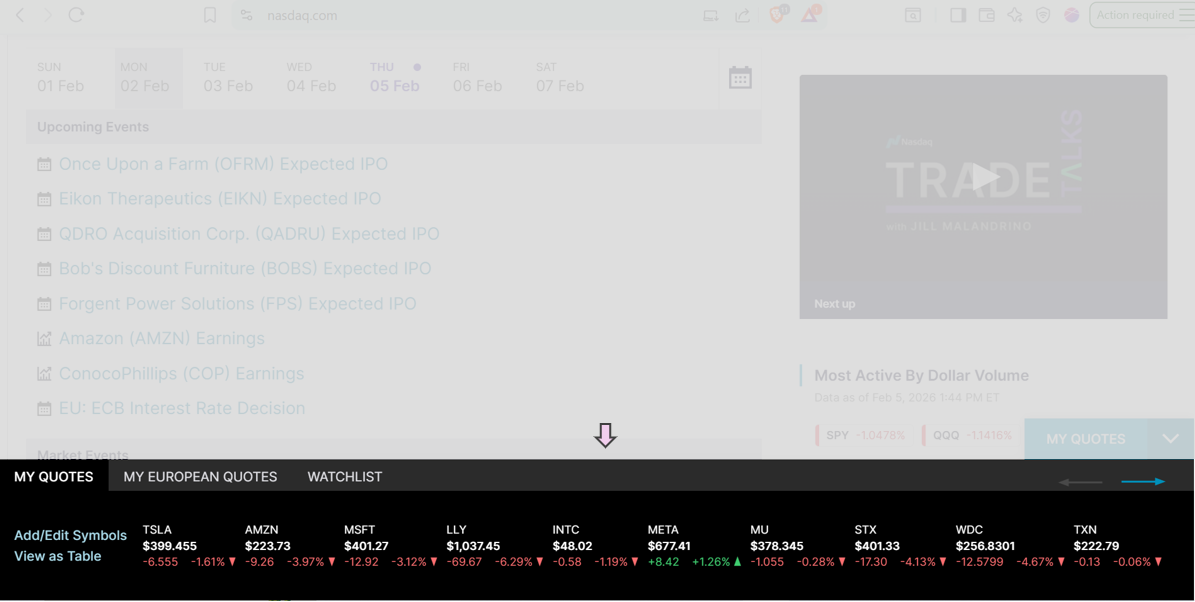
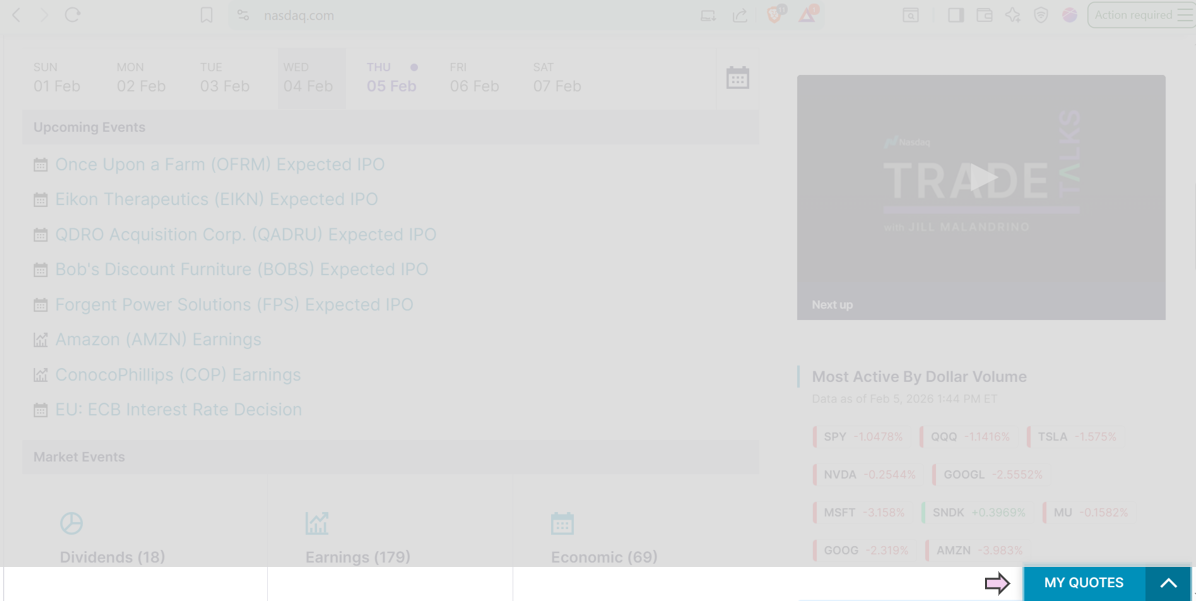
This design helps prevent attentional tunneling. When users focus on one screen, scanning often stops. A persistent side panel supports quick “glance checks” that keep awareness current across the broader situation.
→ Imagine if operational dashboards offered the same glanceable overview — helping users stay aware of system changes while concentrating on specific tasks.
🏎️ “Information Where It Happens”
Principle: Embed Supporting Information in Context
In high-performance driving, the driver should not have to scan separate displays to know when action is needed.
As engine RPM rises, shift lights illuminate directly on the steering wheel — right where attention is already centered.
The cue is embedded at the point of use, helping the driver instantly perceive what is happening, when to act, and why it matters.

This is a simple but powerful SA pattern. Instead of forcing the user to mentally reconstruct relationships from separate indicators, the display places meaning where the action occurs. That reduces cognitive effort and supports faster, more confident response.
→ Imagine if process dashboards did the same: embedding events, limits, and diagnostic meaning directly into the primary view, so operators can immediately see what happened, when it happened, and why it matters.